

Suppose an installer sends a photo of a battery at 60% state of charge. The inverter beside it says 45%. A voltage chart found online suggests a third answer. Before anyone changes a setting or approves a replacement, the distributor needs to establish what each number represents.
LiFePO4 battery state of charge is an estimate of the charge remaining relative to a defined capacity. Voltage is one input, but the flat voltage profile through much of an LFP battery’s working range makes it a poor standalone percentage gauge. A useful diagnosis combines the source of the displayed SOC, battery current, operating conditions and recent charging history.
This article explains how to read those signals in a low-voltage residential storage system. Its numerical examples are deliberately simplified calculations, not ZJBESS test results or promises about a particular BMS. Equipment settings and calibration procedures must come from the instructions for the supplied battery, inverter and firmware.
What the SOC percentage actually measures
SOC describes charge remaining within the capacity reference used by the estimator. Texas Instruments describes the basic relationship as remaining capacity divided by maximum capacity, with both quantities expressed in amp-hours or milliamp-hours. The reference matters: an estimator might use configured capacity, learned capacity or a manufacturer-defined usable range. Ask which applies before interpreting its percentage. See TI’s explanation of SOC estimation for the underlying relationship.
Three questions that sound similar need different evidence:
| Customer question | Relevant quantity | What a single SOC display cannot establish |
| How full is the battery now? | SOC and its capacity reference | Whether the estimator is correctly initialized |
| How much capacity has it lost? | Capacity retention or state of health (SOH), with a stated test method | Capacity loss merely because SOC is low |
| How long can it run these loads? | Available energy, load power and system limits | Backup runtime without knowing the load and reserve |
A battery can reach 100% of its present capacity after aging. That does not restore its original amp-hours. Conversely, a new battery at 30% SOC has a low charge level; that reading alone says nothing about its health. Where SOH is quoted, obtain its definition. Capacity-based and resistance-based health indicators answer different questions.
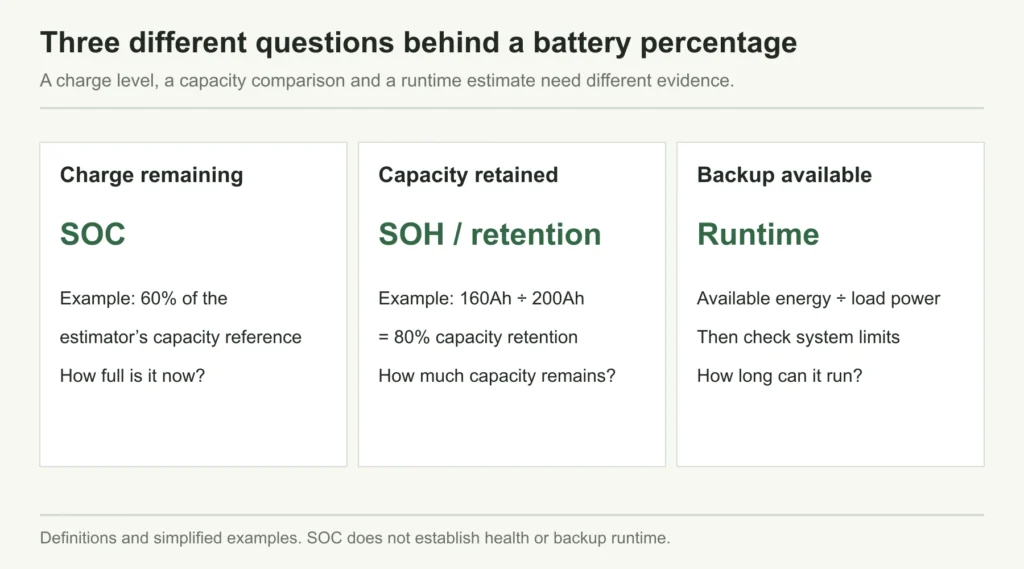
Figure 1. SOC, capacity retention and backup runtime answer different questions. Numerical capacity values are simplified examples.
For a simplified capacity example, suppose a battery originally delivered 200Ah under a defined test and now delivers 160Ah under the same test. Its capacity retention is 80%. If an estimator uses that learned 160Ah as its reference, 100% SOC means full relative to 160Ah. It does not mean 200Ah remains available. This is arithmetic illustrating the definitions, not a statement about how a ZJBESS model reports SOH.
The percentage also needs a boundary. A manufacturer’s displayed zero may correspond to a managed discharge endpoint, rather than removal of every physically stored charge. Likewise, an inverter can reserve part of the displayed charge for backup or stop discharge at a configured level. Establish the display definition and control settings separately.
Why the LiFePO4 voltage curve makes percentage estimates difficult
A voltage gauge works best when voltage changes enough to distinguish one charge level from another. LiFePO4 has a broad, relatively flat open-circuit-voltage region. Texas Instruments discusses this difficulty in its LiFePO4 fuel-gauging article, pages 14–16. Across the flatter part of the curve, a small voltage difference can correspond to a substantial difference in charge.
Think of reading height from a nearly level hillside. An accurate height measurement does not tell you exactly where you stand along it. Better voltage measurement helps, but it cannot make the hillside steep. Near the ends of the charge range the curve becomes more informative, while a precise middle-range percentage requires other information.
LFP SOC research also identifies temperature and aging as sources of error in the open-circuit-voltage relationship. The 2024 paper by Paizulamu and colleagues investigates an estimation method that accounts for these errors.
For a distributor, the consequence is practical: two batteries with similar resting voltage can have different charge histories and different remaining charge. A screenshot showing an ordinary-looking voltage does not prove that a customer’s SOC complaint is unfounded. Equally, a mismatch against an internet table does not prove the BMS is defective.
The conceptual curve below deliberately has no voltage lookup values. It explains why the task is difficult without pretending to be a calibration chart for every cell, pack and temperature.
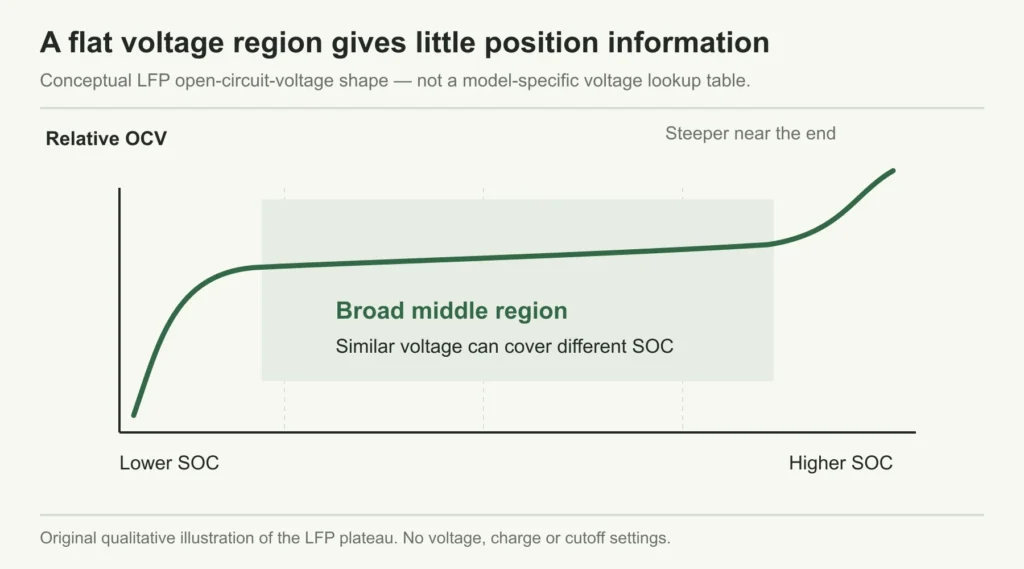
Figure 2. Conceptual LFP voltage plateau. This qualitative curve has no voltage lookup values or operating thresholds.
Reading a LiFePO4 voltage chart: start with its conditions
A LiFePO4 voltage chart can be a rough reference when its conditions match the battery being observed. It becomes misleading when a rested-cell curve is used to interpret a pack under load, or when a chart for one series-cell count is applied to another.
Battery terminal voltage responds to current as well as charge level. During discharge it can fall under load and recover when that load is removed. A recovery in voltage is not a recharge. TI’s voltage-based estimation application note, section 5 explicitly discusses the limitations introduced by current variation, relaxation, aging and temperature. That note concerns specific portable-device electronics; the limitations explain why context is needed, not which settings to use on a residential battery.
Consider a planning example in which an inverter’s voltage-derived percentage falls when a large load starts, then rises when it stops. If no charge entered the battery during the recovery, the higher number cannot represent newly added amp-hours. It may reflect the estimator’s response to terminal voltage. The appropriate evidence is a time-aligned record of current, voltage and SOC around the event, rather than two isolated screen photos.
Before using a chart, establish the chemistry, series-cell count, measurement location, temperature, current and whether the battery was charging, discharging or rested. If rest is required, use the manufacturer’s stated conditions; there is no single rest duration that this article can prescribe for all packs.

Figure 3. Conceptual discharge-load timeline showing voltage recovery without added charge; not a measured product response.
A 48V label does not identify the voltage curve
For cells specified at 3.2V nominal, fifteen in series give 48.0V and sixteen give 51.2V. Both labels appear in the low-voltage storage market. These nominal sums describe pack construction, not voltage at a particular SOC. Confirm the supplied model’s cell count and operating range rather than converting a voltage reading using the label alone.
Even dividing a measured pack voltage by the confirmed series-cell count gives only an average. It cannot reveal the lowest or highest individual cell voltage. This distinction becomes important when investigating an early protection event.
Our battery and inverter compatibility guide covers voltage windows and pairing approval. For the present task, keep the question narrower: is the voltage reference suitable for interpreting this battery’s state of charge under these conditions?
How current counting estimates LiFePO4 battery state of charge
Instead of assigning a percentage from voltage alone, a current-counting estimator tracks charge entering and leaving the battery. For constant current, amp-hours equal current in amps multiplied by time in hours. With variable current, the estimator accumulates the measurements over time. Victron explains this principle in the SmartShunt operating manual.
Take a hypothetical 200Ah capacity reference, initially estimated at 80% SOC. Assume a constant 20A discharge for two hours, with no simultaneous charging and no correction for efficiency or other effects:
Charge removed: 20A × 2h = 40Ah.
Change in SOC: 40Ah ÷ 200Ah × 100 = 20 percentage points.
The estimate moves from 80% to 60%. This says nothing about the exact voltage at either endpoint. Nor does it specify AC energy delivered: voltage changes during operation, and inverter conversion and auxiliary consumption need their own accounting.
The denominator can produce a large error. If a separate monitor were configured for 100Ah while the intended reference was 200Ah, the same 40Ah removal would be interpreted as a 40-percentage-point change. Starting from 80%, it would display 40%, rather than the simplified 60% result. The current reading could be correct while the percentage calculation is wrong.
| Simplified estimator setup | Charge removed | Calculated change | Estimated final SOC from 80% |
| 200Ah reference | 40Ah | 20 percentage points | 60% |
| Incorrect 100Ah reference | 40Ah | 40 percentage points | 40% |
This example is useful in sample acceptance because it separates three issues: whether current is being measured, whether the capacity reference is correct, and whether the starting SOC was valid. Agreement with the arithmetic over one interval establishes none of the remaining lifetime accuracy claims. A real algorithm may compensate for efficiency, estimate usable capacity or combine current with voltage and temperature.
There is another detail worth checking on hybrid systems. Solar output is not automatically battery charging current. If PV supplies a household load while charging the battery, only the portion entering the battery adds charge. Ask whether a displayed current is net battery current, inverter DC current or a particular branch current before using it in an amp-hour calculation.
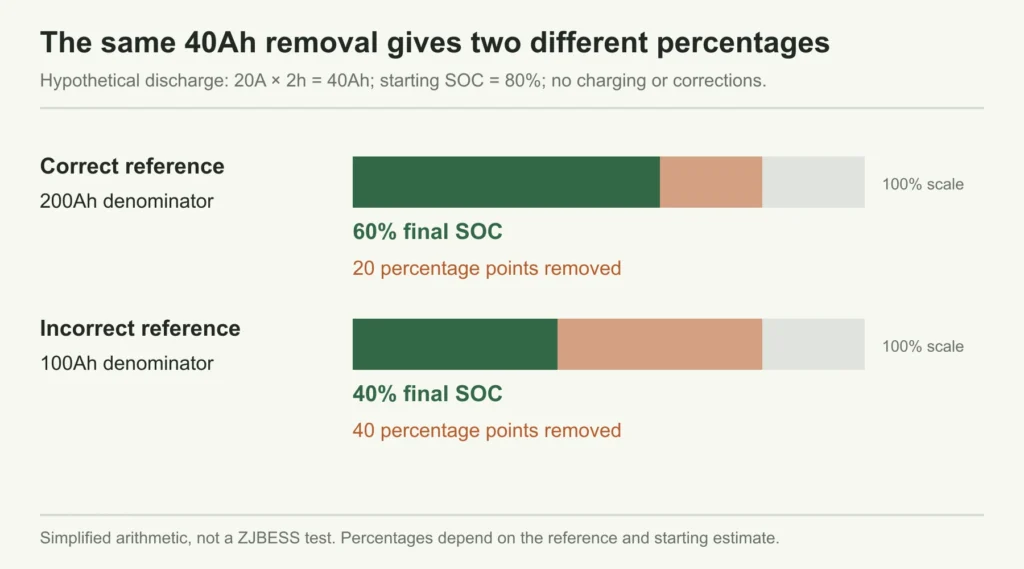
Figure 4. Hypothetical 40Ah removal from an initial 80% estimate: the capacity denominator changes the percentage result.
Why an SOC estimate can drift over several days
Current counting needs a credible starting point and sufficiently accurate measurements. An error in the initial SOC can persist; a small measurement bias can accumulate. Baccouche and colleagues discuss these limitations in their research on an improved coulomb-counting algorithm. The paper concerns lithium-ion estimation in an embedded application, not validation of a residential battery model.
Here is a deliberately exaggerated way to make the accumulation visible. Assume a constant uncorrected current-measurement bias of 0.10A, applied continuously for 24 hours:
Apparent charge error: 0.10A × 24h = 2.4Ah per day.
Against a 200Ah reference, that is 1.2 percentage points per day. Over seven days it totals 16.8Ah, or 8.4 percentage points, if there is no synchronization, compensation, limiting or other correction. The direction depends on the sign convention and direction of the bias. These figures are hypothetical sensitivity calculations, not an expected error rate.
An apparent zero-current condition therefore deserves care. Is the system actually isolated from loads and chargers as required by its procedure, or is there standby consumption? Adjusting an offset while genuine current flows can introduce a new error. TI’s fuel-gauge support explanation confirms the role of current-offset calibration for its named gauge. It is not an instruction to recalibrate a ZJBESS BMS.
A useful distributor question is: what event gives this estimator a new trustworthy reference? Then ask what happens after long partial cycling, a controller restart or a firmware change. Do not assume all BMSs store or reconstruct SOC in the same way. Request the behavior for the revision being supplied, including what the display does while its estimate is uncertain.
Why the battery, inverter and app may show different SOC
Two screens are comparable only after their data sources are identified. One might show the battery BMS estimate; another might use an inverter calculation or an external monitor. A cloud app may show a previously uploaded value. Labels such as “battery percentage” do not establish the route the information took.
This is not hypothetical at the architecture level. In the documented Victron–Pylontech integration, the supported CAN connection carries SOC and control information through the GX device. That example demonstrates a defined data route for the named equipment; it does not establish ZJBESS compatibility with that system.
For the introductory 60% versus 45% example, establish whether both displays are supposed to use the same BMS message. If they do, the investigation starts with communication status, selected source, timestamps and firmware. If they use separate estimators, compare their capacity references and initialization before judging which is closer to the battery’s actual state.
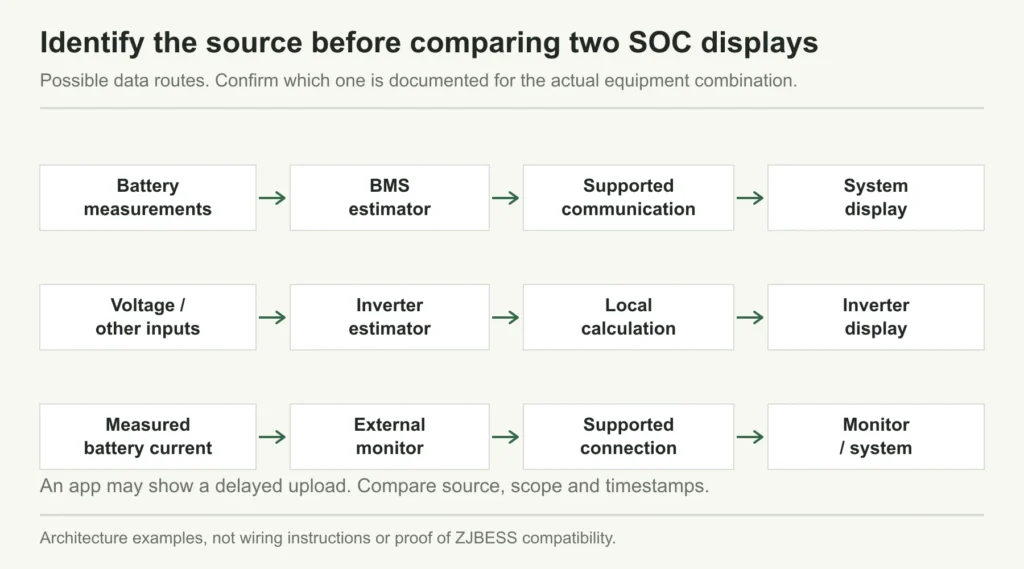
Figure 5. Possible SOC data routes. Confirm source, bank or module scope and timestamps for the actual equipment.
Ask the supplier to describe the SOC path as a simple chain: battery measurement and estimator, transmitting device, receiving controller, local display and app. Record any device that calculates a fresh value along the way. Also identify what happens to the displayed number if communication fails: does it disappear, freeze or change to an approved fallback? That answer determines how service staff should interpret a screen that still looks normal.
In a multi-module system, establish whether the screen shows one module or a bank value, and which modules were online. As a simplified comparison, two equal 100Ah references at 80% and 40% contain an estimated 120Ah in total, or 60% of the combined 200Ah reference. Their voltage and current-sharing behavior is a separate matter. An actual controller may use another defined aggregation rule, so this arithmetic cannot be substituted for its documented method.
Why discharge can stop while the screen still shows charge
A percentage estimate and an operating permission answer different questions. SOC estimates remaining charge. Protection and control determine whether the battery can deliver current now. An inverter reserve, a current limit, temperature restriction or a cell-voltage alarm can prevent discharge while a nonzero percentage remains visible.
Cell information is especially valuable when pack voltage looks ordinary. A series pack is limited by individual cells as well as its total voltage. Victron’s Lithium Smart troubleshooting manual describes early load shutdown associated with cell imbalance, even when overall battery voltage appears acceptable. Its recovery procedures and thresholds apply to its equipment and should not be copied to another product.

Figure 6. An SOC estimate does not override the system mode, reserve or battery operating limits.
A stopped-discharge complaint therefore needs the event reason. If the event is a configured inverter reserve, check the reserve’s purpose against the quotation. If it is a BMS alarm, obtain the alarm code, current, temperature and cell data available for that instant. A flat percentage graph after shutdown may simply show that no more charge is being removed; it does not establish why the shutdown occurred.
Do not “fix” an early stop by reducing protection thresholds or repeatedly restarting the equipment. That can hide the evidence needed to distinguish a display problem from a battery or system limit. Ask the responsible technical team to assess the recorded event under the supplied instructions.
Collect a time-aligned record before changing settings
The first service record should preserve what happened. Photograph the battery and inverter screens close together in time, then record the operating mode and whether PV or grid charging was active. A battery photo taken during discharge and an app screenshot taken after charging are not a valid comparison.
The following observations help narrow the investigation. They are starting points for review, not diagnoses or automatic pass/fail rules.
| Observation | First comparison to make | Evidence to send for review |
| Percentage falls with a load step and rebounds after it stops | Voltage behavior versus measured battery current | Time-aligned voltage, current and SOC trend |
| Battery and inverter disagree persistently | Whether the displays use the same source | Source selection, link status, versions and timestamps |
| Percentage moves roughly twice as fast as the simplified Ah estimate | Configured capacity and modules included | Capacity reference and charge-throughput record |
| Difference grows during repeated partial cycles | Starting reference and documented correction events | Charging history and last valid synchronization |
| Discharge stops with a nonzero percentage | Control or alarm reason rather than SOC alone | Reserve setting, alarm code, temperature and cell data |
Include the exact model, serial or batch reference, firmware and document revisions in the support request. Record whether the problem appeared from commissioning or after a change. Keep a before-and-after settings record if the supplier approves an adjustment, so its effect can be assessed without losing the original configuration.
A statement such as “SOC inaccurate” leaves the technical team to guess. A better request says: “The inverter is configured to display battery BMS SOC. At the recorded time the battery showed 60% and the inverter 45%; the attached log includes battery current, voltage, temperatures and communication status.” That is a suggested reporting format using the introductory example, not a real customer incident.
Synchronization corrects the reference; it does not add capacity
Synchronization gives an estimator a known reference. In a current-counting monitor, that may mean recognizing a valid full-charge event and aligning the displayed SOC with it. The correct event and procedure depend on the equipment.
For example, Victron’s SmartShunt operation instructions, section 5.7 describe automatic synchronization based on charged voltage, tail current and a detection period. This is an example of several conditions acting together, not a universal recipe. Its voltage and timing values must not be transferred to a different pack or BMS.
A manual reset to 100% changes the estimator’s reference. It does not charge the cells or repair lost capacity. If the battery is not actually at the required full-charge condition, the reset can make the next displayed percentage less useful. Similarly, forcing a full discharge to “teach” the gauge is inappropriate unless the manufacturer specifically requires and controls that procedure.
For procurement, request the approved initial commissioning process, the conditions for later correction and the response when those conditions cannot be reached in the site’s normal operation. This last point matters for systems held within a partial charge window: monitoring behavior should be understood before making a promise about the display.
Do not schedule extra high-voltage charging or deep cycling merely to make a number look right. Where the display also affects charge or discharge control, have the supplier explain the approved procedure and its consequences for the system.
Agree on display behavior before the first distributor order
A sample demonstration should show the monitoring behavior customers will actually see. For a supplier-agreed observation sequence within normal operating limits, capture the reported SOC source, a charge interval, a discharge interval and any documented reference-correction event. Keep the equipment versions and capacity configuration with the record.
Define acceptance criteria with the supplier before interpreting the results. Comparing the battery screen with an inverter receiving that same BMS value checks transmission and display consistency. It does not independently measure SOC accuracy. A stronger accuracy claim needs a stated reference method, operating conditions, error definition and validation record.
Also ask what is included in local support: access to cell data, exportable logs, explanation of alarms, approved settings and procedures for firmware changes. For distributors, that information can be more useful than a percentage shown to one decimal place. More digits are not evidence of a smaller estimation error.
For a ZJBESS monitoring review, send the intended battery model and module count, full inverter model, firmware, destination market and screenshots or logs through the ZJBESS contact page. Request confirmation of the SOC source, capacity reference and approved commissioning procedure for the proposed combination. State separately whether you need documents for a new quotation or help reviewing an installed system.
Questions installers and distributors ask about LiFePO4 SOC
Can I calculate SOC from battery voltage alone?
You can make a rough estimate only within the conditions of an appropriate voltage reference. LFP’s flat middle region makes a precise standalone percentage difficult. Under load, use current and operating history alongside voltage. A generic chart cannot validate an estimator’s accuracy.
Is BMS SOC always more accurate than inverter SOC?
The label alone is insufficient. First find out whether the inverter receives BMS SOC or calculates its own value. Then check the estimator’s configuration, initialization and documented validation. If both screens use the same BMS value, agreement verifies the data path rather than the underlying estimate.
Does 100% SOC mean the battery still has its original capacity?
No. It means full relative to the reference used by that estimator. Capacity retention requires a defined capacity comparison; backup runtime also requires load, usable energy and system-limit information. Our cycle-life guide explains why retained capacity needs stated test conditions.
Should I change charging voltage when SOC will not reach 100%?
A percentage alone is insufficient grounds for a voltage change. Preserve the charging history and check the supplied instructions and synchronization conditions with the supplier. A charging limit, estimation reference and cell-related event require different responses.
Can a 50% reading guarantee half the advertised backup time?
No. The available operating window, capacity reference, load and power limits all affect runtime. Use a verified monitoring value as one input to the home battery sizing calculation, then check whether the battery and inverter can supply the intended loads.
Discuss Your ProjectBack to Blog

